Disaster Management
Insurance Analytics
Ellipsis Drive and Catastrophe Modelling
Mastering your spatial data is critical for managing your risk.
In this article, we take a deep dive in how spatial data management layers into Catastrophe modelling and how Ellipsis Drive can help you make more efficient use of your spatial data, streamline your processes and turn curves and tables into insightful maps.
Contents
Let’s start with the Basics
A catastrophe model consists of four main components or steps:
- Determining the stochastic events we are considering.
- Calculating the hazard for each of these events which translates into determining their footprint.
- Then, we are able to calculate the damage according to the vulnerability curves of, for example, the types of buildings considered.
- This ultimately leads to quantifying the financial loss by applying financial modules depending on the insurance and reinsurance policy structures.
For a catastrophe model to run, the primary input is Exposure Data which is information about the location and characteristics of the considered assets or people. Seeing as any model will just run on what you throw at it indiscriminately, the quality of the input data anchors the potential for quality of the output (rubbish in equals rubbish out). This means that having quality data as a catastrophe modeler is fundamental for your ability to create an accurate representation of the risk and lessens the assumptions you might need to rely on.
That said, let’s dive into the fundamental inputs of exposure data:
Inputs of Exposure Data
- Location information: a must for geocoding,which is the process of finding the closest latitude/longitude coordinate for risk and determining where the model crosses the risk. Naturally, differing data quality or gaps in the location information will lead to different geocoding resolutions.
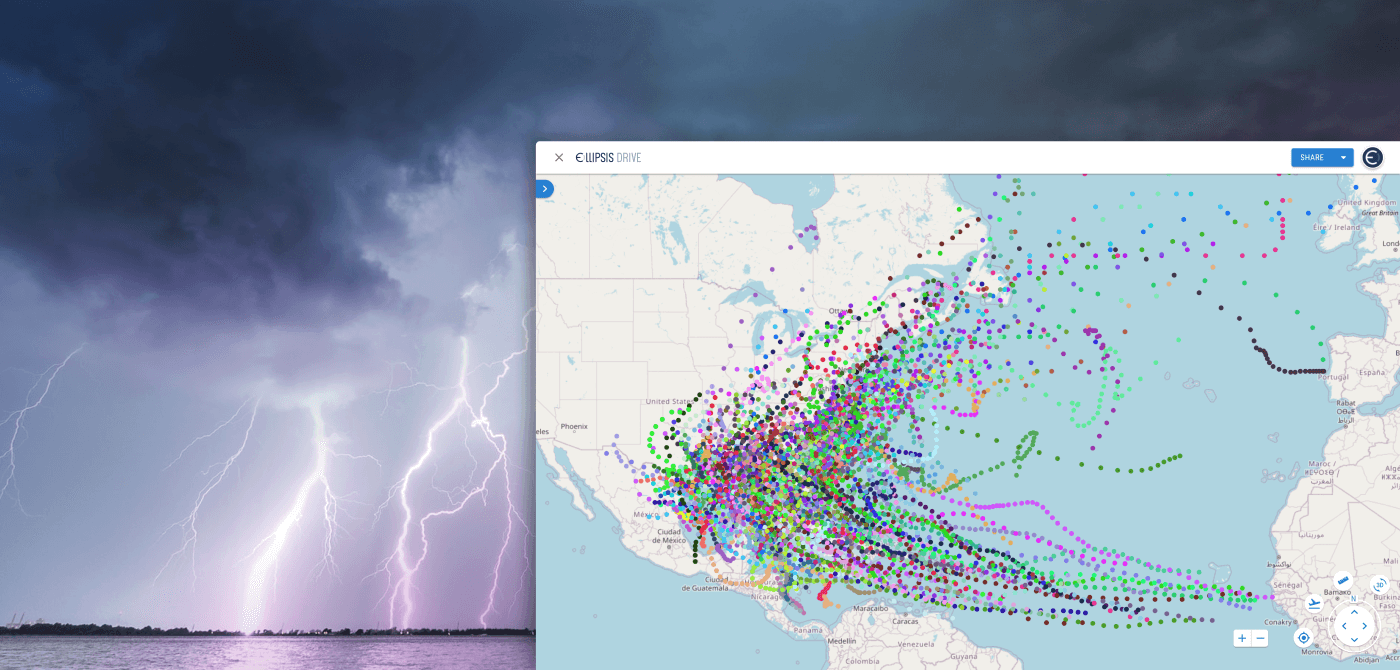
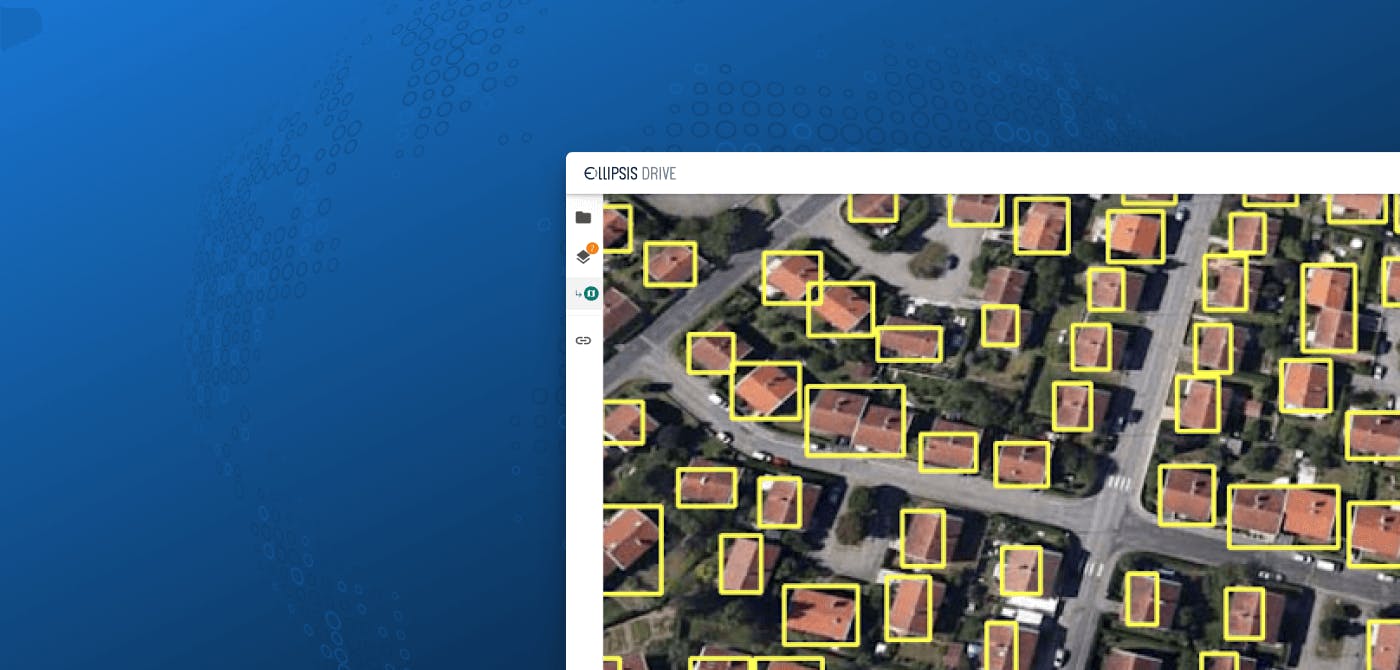
Ellipsis Drive is highly relevant in this step as it ensures fast ingestibility and interoperability between (geocoding) vendors - who provide needed information - and catastrophe modellers - who put this information to work. Each provider has proprietary standards in structuring its data, so lengthy ingestion and integration processes to effectively leverage geocoded data is commonplace. By using Ellipsis Drive, any data with x/y coordinates get automatically parsed, indexed, tiled and standardised. Ready for high performance use by any kind of modeller, developer, or data scientist in their own tools of choice. - Coverages and total insured value: This refers to the total insured value of the building, the contents of the building, and the cost that might occur from an eventual business interruption, especially when the building is of a commercial or industrial nature.
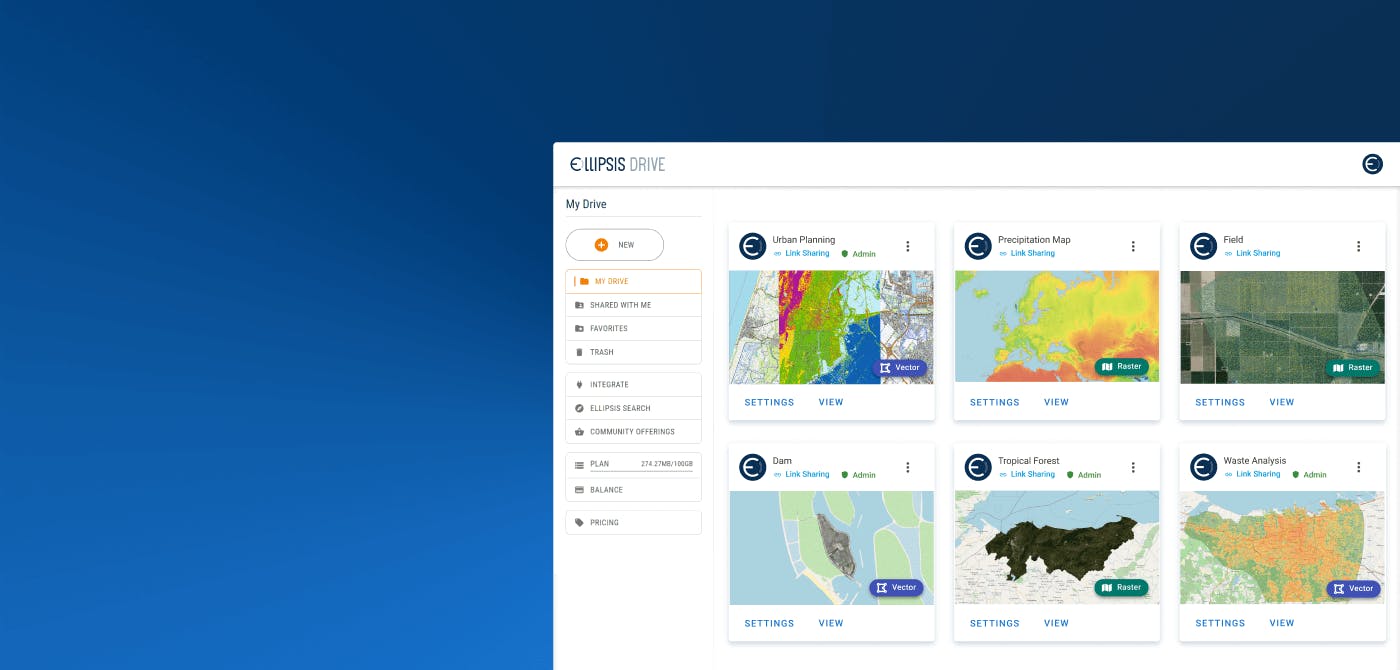
Ellipsis Drive is the perfect tool to display your portfolio on a map with all the coverage-related metrics. You can have the Total Insured Value shown by building, account, portfolio, or country. In addition, you can access other metrics that might be very insightful when displayed graphically, such as the claims history, composite ratio etc. The purpose is to provide a new form of policy/account/portfolio presentation that holds meaning for both a technical and non-technical personnel - Construction information: This includes information such as building construction materials, occupancy, year built, building height etc. as different vulnerabilities within the model that significantly affect the model losses.
Here, Ellipsis Drive is an excellent tool for structuring and unifying those characteristics (which may hail from different data sources). So as long as each can be matched with an (x,y) coordinate, data can be easily linked and flexibly queried.
Main metrics in Catastrophe Modelling
Now that we have a view of the different inputs that go into a Catastrophe model, and how ED automates the process of ingesting, standardizing and unifying these inputs. Let us now focus on its main metrics:
- Average Annual Loss or AAL: Insurers need to generate at least this premium amount per year to cover expected losses from the modeled perils over time.
- Occurrence Exceedance Probability or OEP: The probability of exceeding a loss from a significant event in a year.
- Aggregate Exceedance Probability or AEP: The probability of exceeding a loss from all events in a year. AEP will always be the same or larger than OEP for high-frequency perils.
- Return periods: 1 in 50 years(2%), 1 in 100 years (1%), 1 in 200 years (0.5%)…
Here, ED is a powerful tool for graphically displaying those metrics, whether on a policy basis, an account basis, or a portfolio basis.
Key Modelling Outputs
Then last but not least, the key modeling outputs:
- Event Loss Tables or ELT: Losses per event on the model contain the mean event loss and standard deviation.
- Period Loss Tables or PLT: Losses per period. The latter is usually a year but contains a set of events.
- Sample output: Use a Monte-Carlo simulation to randomly sample from the “effective damageability distribution,” which is a convolution of the hazard intensity and vulnerability distribution of the even-exposure combination. This damageability is sampled n-number of times based on the user. The sampled output is the mean across the sample set and is the recommended view when analyzing insured losses.
- Analytical output: It gives an average over the entire distribution, which is relevant from the ground-up perspective.
When looking at key modelling outputs, Ellipsis Drive provides a range of visualisation, management and integration options to help users interpret and communicate the results of their modelling efforts graphically. It also supports your advanced analytics workflows, such as sensitivity analysis and scenario modelling, to help users better understand the potential impacts of various catastrophic events.
Conclusion
When deep diving into how spatial data management plays into Catastrophe modelling and where Ellipsis Drive can help you make this easy, we find that Ellipsis Drive provides a comprehensive solution that streamlines and enhances the modelling process from start to finish. Ushering in automated spatial data standardization, unification and interoperability to improve your process’ accuracy, efficiency, and scalability. Ultimately generating better and up-to-date insights that leads to superior risk management and resilience in the face of disasters.
Liked what you read?
Subscribe to our monthly newsletter to receive the latest blogs, news and updates.
Take the Ellipsis Drive tour
in less than 2 minutes'
- A step-by-step guide on how to activate your geospatial data
- Become familiar with our user-friendly interface & design
- View your data integration options
Related Articles
Tackling Land Subsidence with Ellipsis Map Engine
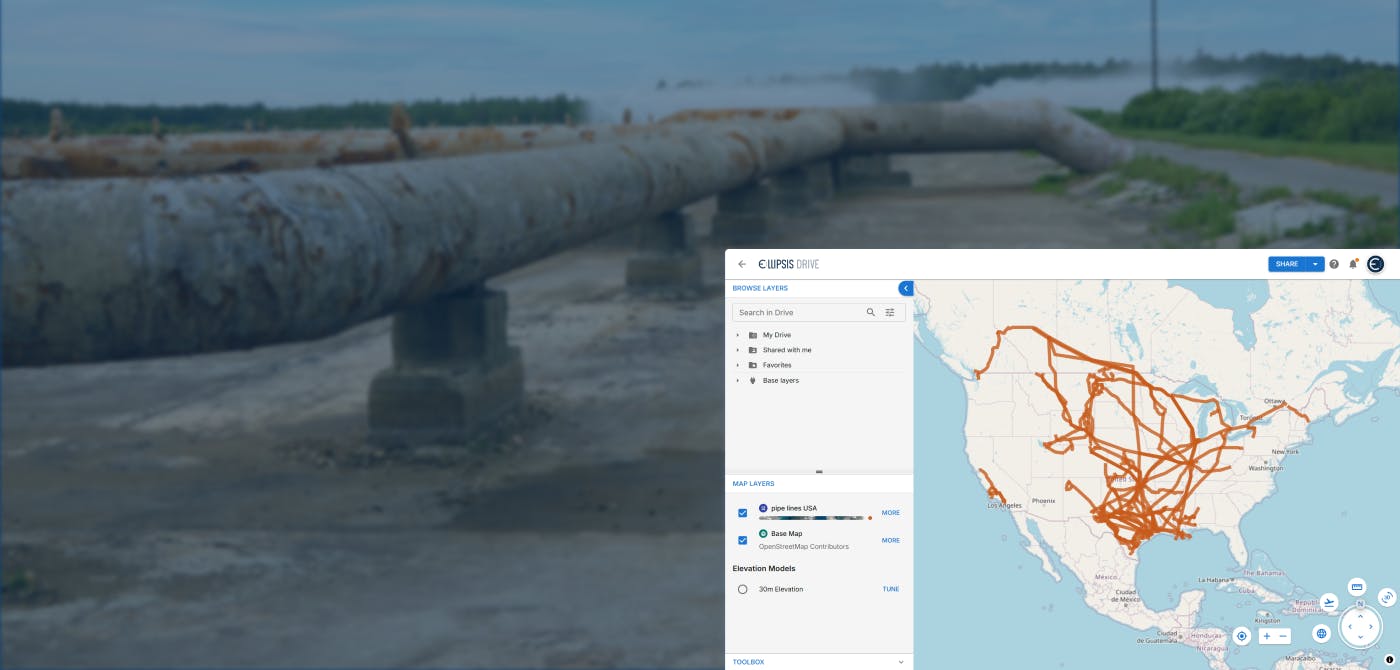
Pipeline infrastructure is central to the Oil & Gas industry, enabling the safe and efficient transport of resources across long distances. But this infrastructure faces constant threats from natural
5 min read
Opportunities for the Insurance Industry (2023)
What is the difference between a challenge and an opportunity? It could be argued that they are one and the same. That a challenge is just an opportunity in disguise. In need of someone to innovate a
7 min read
How to Build a Spatial Data Catalog
Let’s start off with a hypothetical example. Say you are the manager of an Amazon warehouse and you receive an order to ship a book (maybe The Salt Path by Raynor Winn). But none of the million thing
5 min read