Use Case
The Waterschapshuis: Drought Monitoring in The Netherlands
Introduction
Despite the small size of the country, The Netherlands is the second largest exporter of agricultural products in the world. What’s their secret? What makes them tick? Well, it is a combination of ideal climatic conditions, fertile soil and know-how. But there is one other factor that probably goes under the radar sometimes, they have well and truly embraced technology and mastered the art of meticulous water management and engineering.
In this article, we will take you through one such use case which demonstrates this fact, where the relevant organizations have found a smart and efficient way to manage and monitor droughts in the country.
The Vision
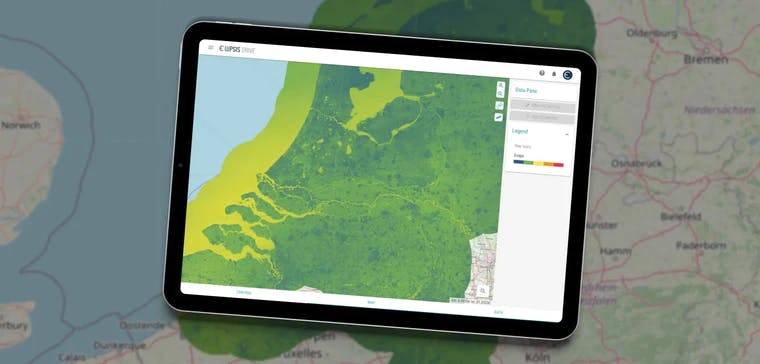
The Waterschapshuis is a central organization under which all the Dutch water authorities reside. The organization envisioned the creation of a nationwide drought management system that would be updated on a daily basis to provide real time information to relevant stakeholders. Waterschapshuis owns years worth of drought related data that primarily consists of precipitation reports and soil moisture content among other details. Waterschapshuis knew this data combined with live inputs would be an excellent tool to draw insights from and identify patterns for water and risk management nationwide.
The Netherlands is known for its meticulous water management. Not without good reason of course. The country has historically been a master of tapping its coasts, river banks and delta land in between. As a result, they have managed to keep their feet dry, rivers flowing and crops watered.
The Solution
The Waterschapshuis decided to approach Dokdata to bring their vision to life. Dokdata was asked to create a dynamic drought map or dashboard. A dashboard that would convert year’s worth of data into real time information. The dashboard would come in handy to visualize, analyse and query the drought data. This would in turn help policy makers to predict and be prepared for droughts in their respective areas. In other words, a low threshold way to understand where drought strikes.
Role of Ellipsis Drive
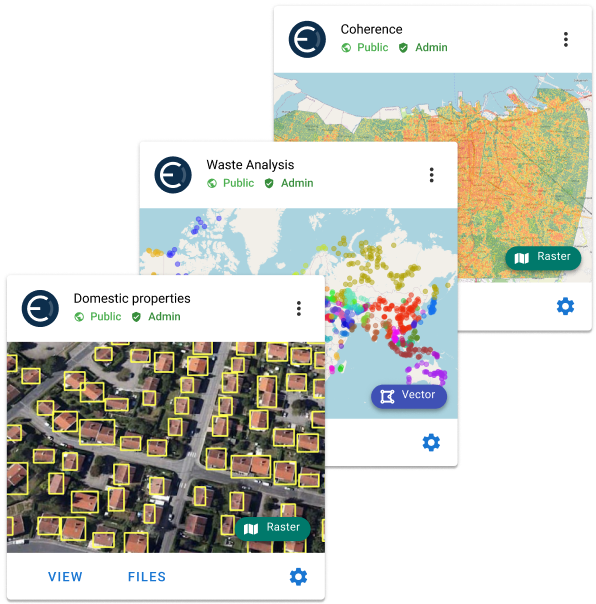
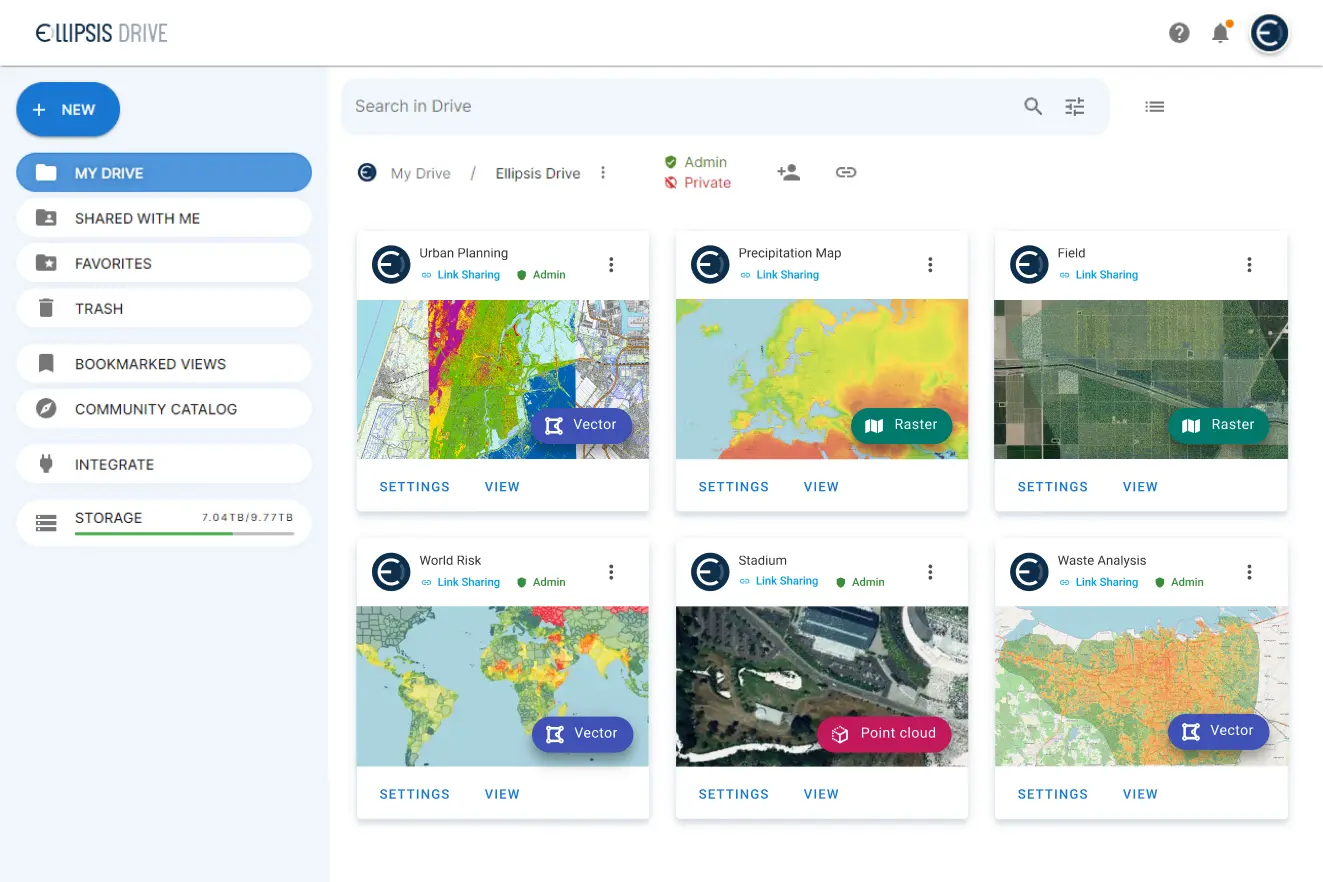
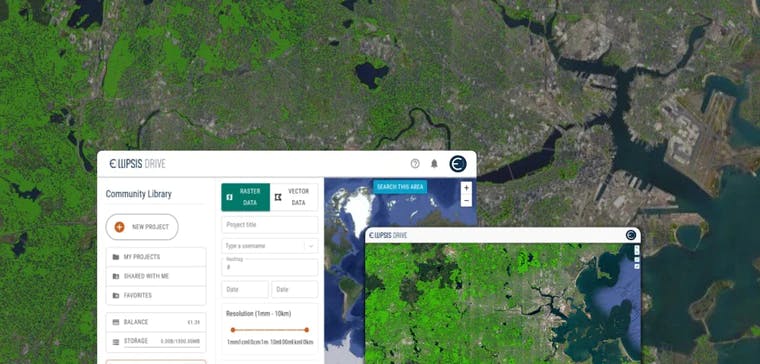
For this project Dokdata decided to use Ellipsis Drive as its off-the-shelf backend. Being an expert in converting geospatial data into real-time maps, Ellipsis Drive offered the required backend capabilities that Dokdata needed to build the dashboard easily. Features such as a structured database and tileservice for all data layers were leveraged, that were needed to display the live maps at high performance without any lag.
Conclusion
Getting to the top is tough and staying up there is even tougher. The Netherlands has been the top agricultural exporter in the world because of initiatives such as these. A constant desire to embrace technology and cover all bases has made this happen. And this is just another example of this forward looking attitude!
Liked what you read?
Subscribe to our monthly newsletter to receive the latest blogs, news and updates.
Take the Ellipsis Drive tour
in less than 2 minutes'
- A step-by-step guide on how to activate your geospatial data
- Become familiar with our user-friendly interface & design
- View your data integration options
Related Articles

Build Smart, Not Hard: How Element 84 Guides Clients with Spatial Data Infrastructure
For this episode of the Ellipsis Drive podcast, we sat down with Dan Pilone, CEO of Element 84, a geospatial engineering firm known for guiding organizations through some of their toughest technical
5 min read
EarthDefine: Protecting the Earth's Green Cover
Trees are the single most selfless beings on this planet. They have given so much to this world in so many ways. We literally owe them our lives by breathing in the precious oxygen that they produce.
3 min read
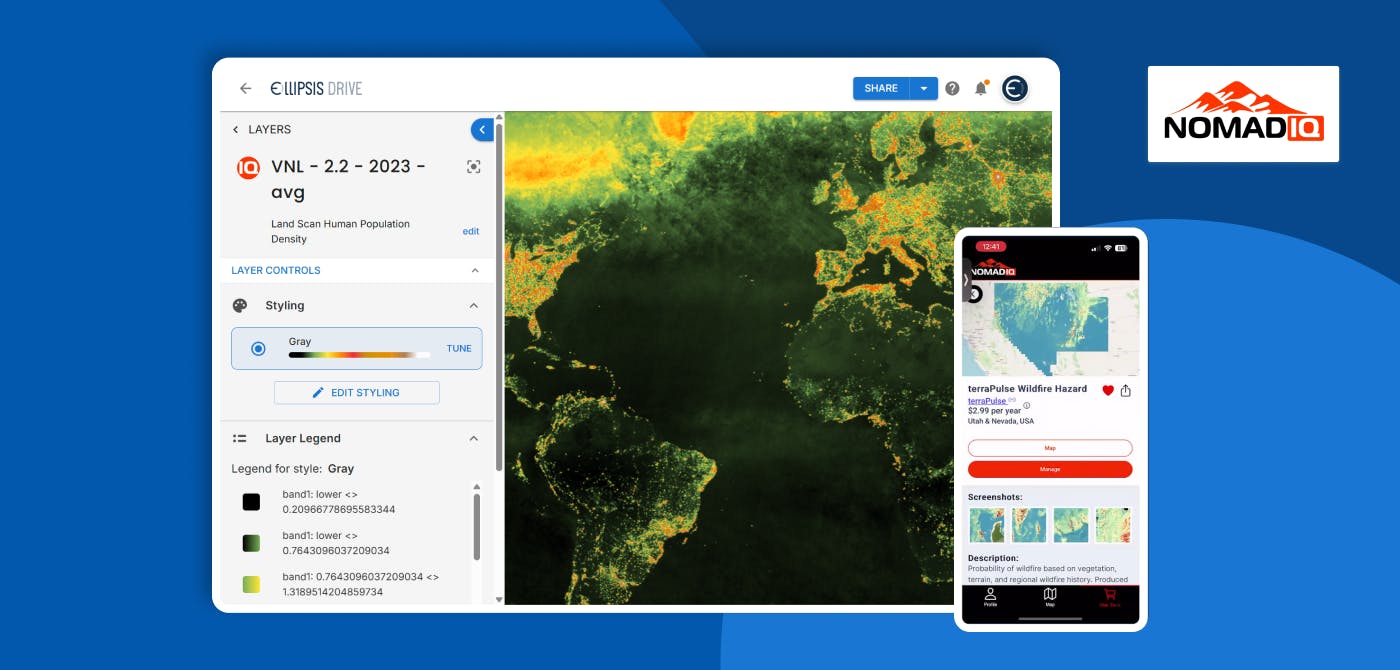
Connecting Earth Observation Datasets to End Users Ft. NomadIQ
“From established basic research and government land management to growing demand in carbon markets, hazard insurance, and even recreational apps, there's a rapidly developing market for satellite-ba
5 min read