Insurance Analytics
Spatial Data Analytics in the Insurance Industry

Contents
Introduction
Put your hand to your heart. Do you feel climate change happening? Do you notice it directly affecting you? A lot of people find it difficult to point to concrete evidence of a changing climate in their own lives (If you are someone who has an easy time doing so, you probably consider those who can’t to be very lucky). It’s similar to the process of evolution or understanding an iconic historic event. You don’t know it’s happening, or what it means, while you are living it. But when you look back, it becomes much easier to put into perspective. Hindsight is a tricky teacher that way.
If you want proof of climate change, simply take a closer look at the catastrophic events that are, and have been, occurring all over the world with increasing frequency and intensity. No, this piece of information is not meant to scare you. It’s simply meant to highlight what is already happening and what you probably already know.
We are introducing this article in this way to show that ignorance isn’t bliss anymore. It is a choice. And for some industries it is public enemy number 1!
As a consequence of the growing frequency of catastrophic events, the insurance industry suffers huge losses in every sense of the word. In terms of financial losses, the number goes way beyond the trillion dollar mark. Seeing as most people and companies hold multiple insurance policies, the challenges faced by insurance carriers are noticed in all corners of the world and in all levels of society. Think about delays in reimbursements, lack in coverage, or rising premiums. As such, the insurance industry wants to understand what is happening, as it is happening. Not seeing or understanding the effects of climate changes simply won’t do.
The good news is that the insurance industry seems to have found a new ally in its effort to deal with a world that sees more and more extreme events: Spatial data analytics.
Spatial data analytics has given the insurance industry a fresh breath of air. Spatial data or location data has grown in significance over the last decade or so. But what does spatial data analytics mean? And how does it help the insurance industry to stay in business and help people manage risk all over the world?
Let’s find out
What is Spatial Data Analytics in Insurance?
Any dataset that has a spatial or location component to it can be called spatial data. Using GIS softwares, spatial data can be created, visualized and analyzed to identify insights, trends and patterns. GIS analysts and data scientists work on the spatial data to create analytics that are used for informed decision making.
Spatial data analytics is able to use historical data sets and apply algorithms on them to create predictive models that allow stakeholders to make smarter decisions. Spatial data is hosted on GIS softwares by analysts and data scientists to create forecasts and business models.
The insurance industry can be considered to be the “OG” big data industry. The insurance sector has always relied on tonnes of data in order to create policies, hedge risks and reimburse claims. It is not the lack of data that is the problem. It’s the lack of structure. There is so much data, of so many different types, that stakeholders have a hard time deciphering it and deducing insights.
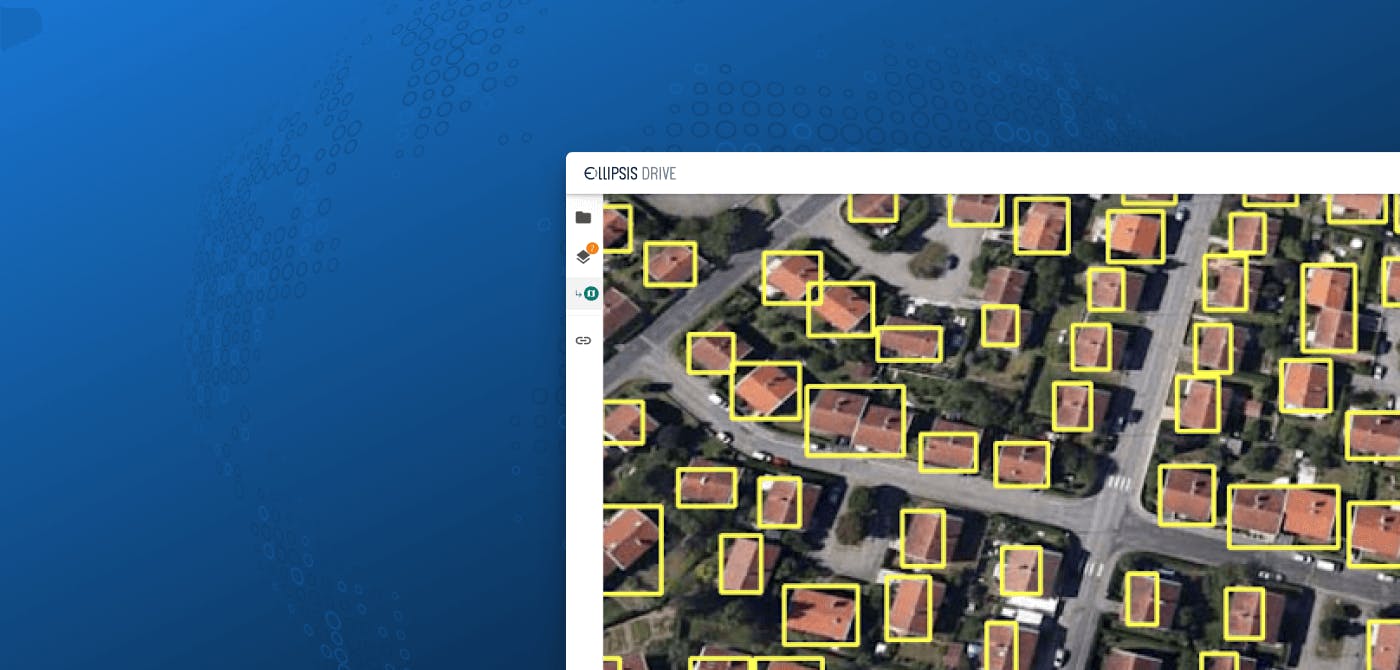
Visualization is key to understanding data. One of the key functions of GIS softwares (and the analysts of course) is that it helps insurance stakeholders sift through and visualize the information.
Many decision makers are not in a position to effectively leverage spatial data. But with the help of new softwares and technologies, spatial data and spatial data analytics can become easy-to-consume for everyone in the insurance industry and beyond.
What is the need for Spatial Data Analytics in the Insurance industry?
As mentioned earlier, the insurance industry is facing trillions of dollars of losses as a result of the erratic nature of catastrophic events.
Predictability is what works in favor of the insurance industry. It’s what nature refuses to offer cut and dry, but also exactly what spatial data analytics can accomplish anyway. By assessing past events, insurers are able to get a location-centric insight into a situation or risk.
Location intelligence gives rise to situational awareness which is crucial. It allows for risk hedging, predictive analysis and a lot more. Stakeholders can budget and prepare for unforeseen events. Insurance companies are also in close contact with disaster management and government agencies in order to minimize the losses.
In the next section, we’ll look at how spatial data analytics is applied in some of the insurance verticals.
Applications of Spatial Data Analytics in different insurance verticals
Underwriting - Underwriters need to find the right balance between lucrative business propositions and ensuring solvency. Underwriters need to account for the changing landscapes and climate changes in order to create a hedged portfolio. By having scientific analytical backing to the underwriting process, the entire insurance ecosystem becomes more balanced.
Catastrophic Event (CAT) management - Real time GIS is becoming a great value add towards tackling natural disasters. Time becomes a precious asset, and the difference between life and death. Insurance teams are able to pass on key information to on-sight disaster response teams to protect life and property.
Claim Processing - With spatial data analytics, claim processing teams are able to identify the severity of situations and ensure faster claim processing to affected parties. Traditionally, the process was not optimized and was prone to delays. During critical times, the speed of resolving these issues becomes invaluable.
Closing thoughts
“You can’t predict the weather, you can only prepare for it”
There is a lot of truth in this statement. Preparation is key. That is what spatial data analytics has to offer to the insurance industry to better serve its clientele and deal with a changing risk landscape.
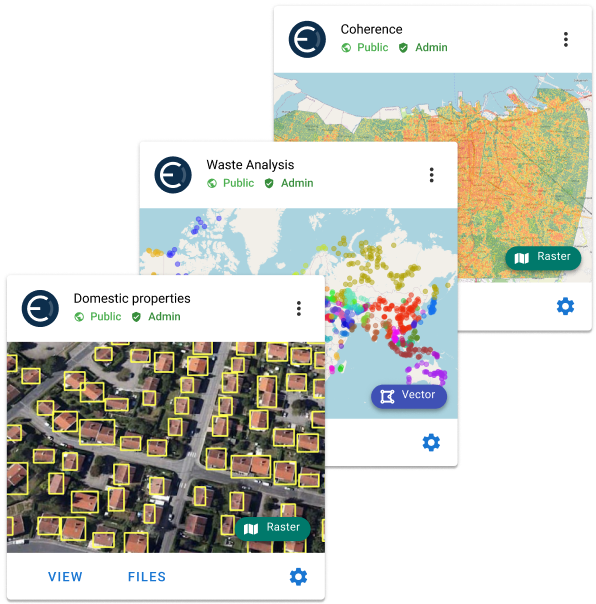
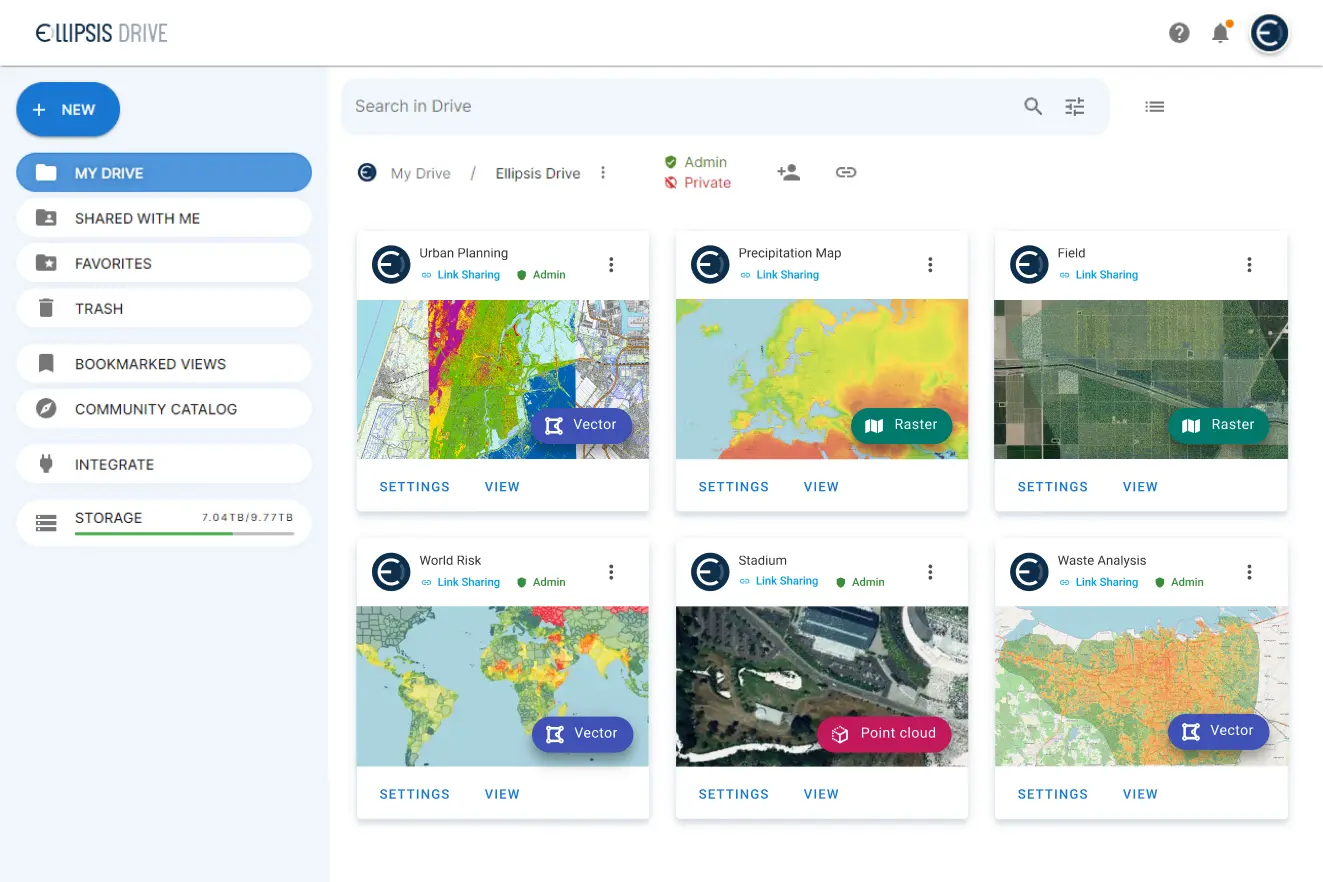
Ellipsis Drive is the world’s first drive for spatial data management. Taking you away from wrangling with big and messy datasets, and enabling easy consumption of structured spatial content for any internal and external user. Save your team years of work and check out our solution to know more.
Liked what you read?
Subscribe to our monthly newsletter to receive the latest blogs, news and updates.
Take the Ellipsis Drive tour
in less than 2 minutes'
- A step-by-step guide on how to activate your geospatial data
- Become familiar with our user-friendly interface & design
- View your data integration options
Related Articles
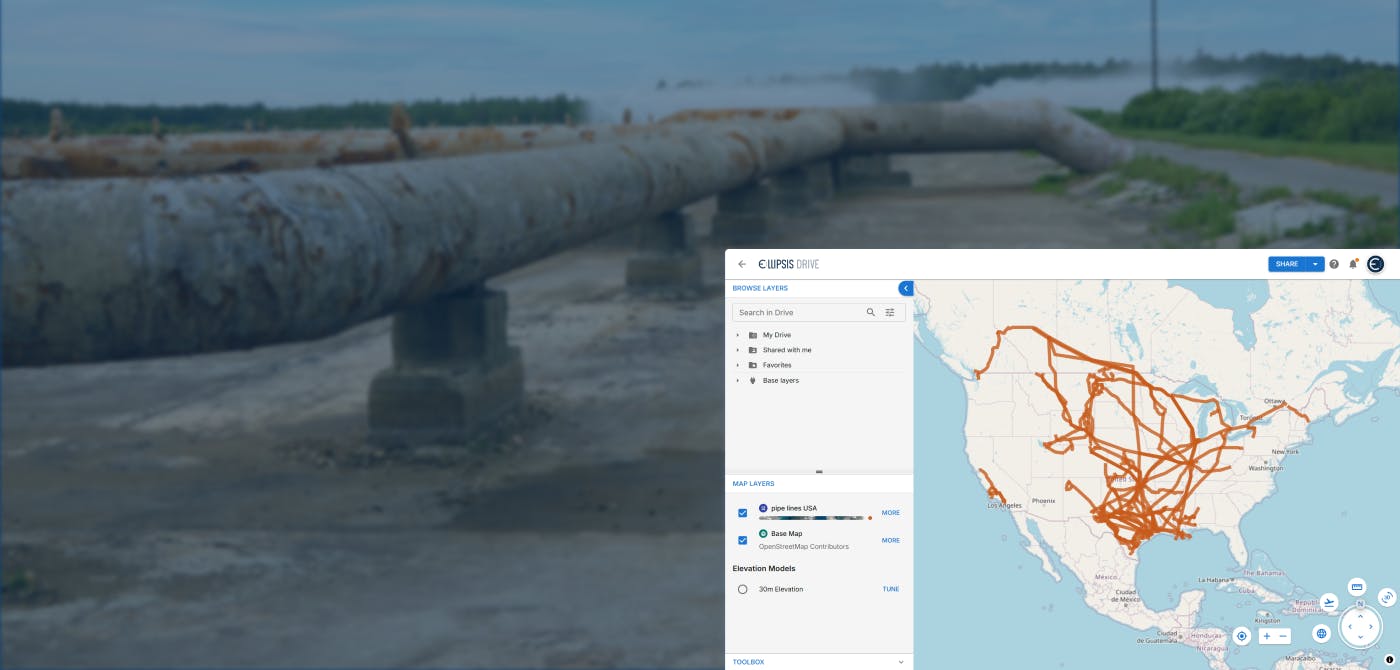
Tackling Land Subsidence with Ellipsis Map Engine
Pipeline infrastructure is central to the Oil & Gas industry, enabling the safe and efficient transport of resources across long distances. But this infrastructure faces constant threats from natural
5 min read
Opportunities for the Insurance Industry (2023)
What is the difference between a challenge and an opportunity? It could be argued that they are one and the same. That a challenge is just an opportunity in disguise. In need of someone to innovate a
7 min read
How to Build a Spatial Data Catalog
Let’s start off with a hypothetical example. Say you are the manager of an Amazon warehouse and you receive an order to ship a book (maybe The Salt Path by Raynor Winn). But none of the million thing
5 min read