GIS
Unlocking the Potential of Data: Comparing Tabular and Non-Tabular Protocols

Contents
Introduction
The world of data is a complex landscape and each year, the complexity of that landscape grows exponentially. A combination of new data capturing technology, data processing technology and demands for big data analytics from new market segments have contributed to this exponential growth. From tabular time-series data to high-resolution satellite imagery, every type of data demands its own unique tools, protocols, expertise, and storage strategies.
In this article, we explore these datasets along with the tools and protocols necessary to tap into their potential. Let’s go!
Table-native vs Non-table-native Data Types
All data types can be broadly categorized into table-native and non-table-native formats, let's look at the differences.
Table-native data
Table native data is easily structured into rows and columns, making it ideal for storage and computation in tabular formats, such as;
CSV files: Contain rows of data separated by commas, often used for time-series or metrics.
Excel files: Similar to CSV but supports complex formatting and embedded functions.
SQL databases: A database type that can contain any type of tabular data.
Vector data, which is structured geographic information (e.g., points, lines, polygons) and often stored in formats like GeoJSON or Shapefiles, can arguably be considered non-table-native data. It is more intuitive to consider it map-native data, due to its spatial nature (in your head, you’d like to project it onto a map). Yet, vector data can still be stored in a table because each row can be dedicated to a specific point/line/polygon and its properties.
Working with Table-native Data
As we zoom in on the use of table-native data, it is helpful to understand systems like Databricks, a leading solution for handling and analyzing tabular data. Databricks is a unified platform built on Apache Spark designed to help process and analyze large-scale tabular data.
Databricks’ strengths lie in its ability to handle structured and semi-structured data efficiently for parallelized computing, making it the go-to analytics toolbox for business intelligence, machine learning, and big data workflows.
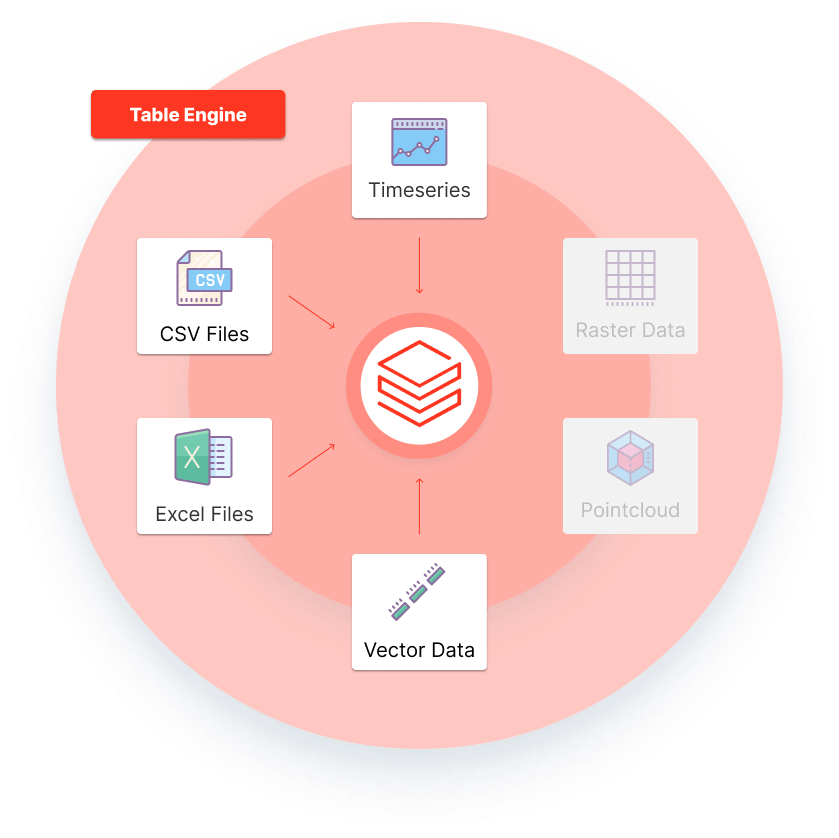
Core Strengths of Databricks
ETL Workflows: Seamlessly extract, transform, and load data into formats suitable for analysis.
SQL and ML Integration: Provides SQL interfaces alongside Python, R, Scala, and Java for data manipulation and model training.
Delta Lake: An optimized data storage format for maintaining high performance and reliability in data lakes.
Visualization: Generates dashboards, charts, and reports to uncover insights.
While a Databricks-like solution is irreplaceable when dealing with structured and semi-structured tabular data, they struggle with geospatial data like rasters or point clouds.
Now let’s explore deeper non-table-native datasets such as these.
Non-table-native data
These data types lack the structured row-and-column format, instead representing complex relationships or spatial dimensions. Common examples include:
Raster data: Composed of grids, arrays or pixels (e.g., satellite images, heatmaps, weather maps, Digital Elevation Models).
Point clouds: Large collections of 3D coordinates, often produced by LiDAR or sonar scans.
As mentioned earlier, vector data types can - while still being ingestible into a table - also be considered non-table-native data as they can be more logically thought of as map data.
These data types (especially raster and point cloud) demand specialized tools for spatially aware analysis and visualization, as their native characteristics do not lend themselves to ‘regular’ table-based processing. Let’s look at the limitations of using standard table engine solutions for non-tabular data.
Limitations of using Table Engines for Raster and Point Cloud Data
Ingestion — Tabular engines like Databricks are optimized to ingest data that is easily captured in a table. Raster data does not fit into that category and requires a raster-native solution to make it easy to break down into smaller tiles for parallelized analysis. Without a raster native solution, Data Scientists sink many hours into creating awkward workarounds where spatially-aware sharding and parallelized compute are extremely hard to accomplish.
Interoperability — Databricks is unable to help users break down large raster datasets into tiles and doesn’t support the reconstruction of spatial data layers post-analysis either. As such, the results are not interoperable and can’t be automatically used in various (GIS-powered) systems.
Visualization — Easy and performant visualization of spatial analysis results also require numerous additional steps from the Data Scientist wishing to deliver insights.
All in all, table-native solutions such as Databricks are poorly compatible with spatial data. With raster and point cloud data, such tabular engines are incompatible on a mathematical level, as these data types can’t fit into a table format without very significant trade offs (such as summarizing them into vectors with aggregated metrics) and because these data need to be sharded in a spatially-aware fashion, respecting their projection. A specialized spatial data management solution is integral for dealing with non-tabular spatial datasets.
Ellipsis Drive: The Specialist in Spatial Data
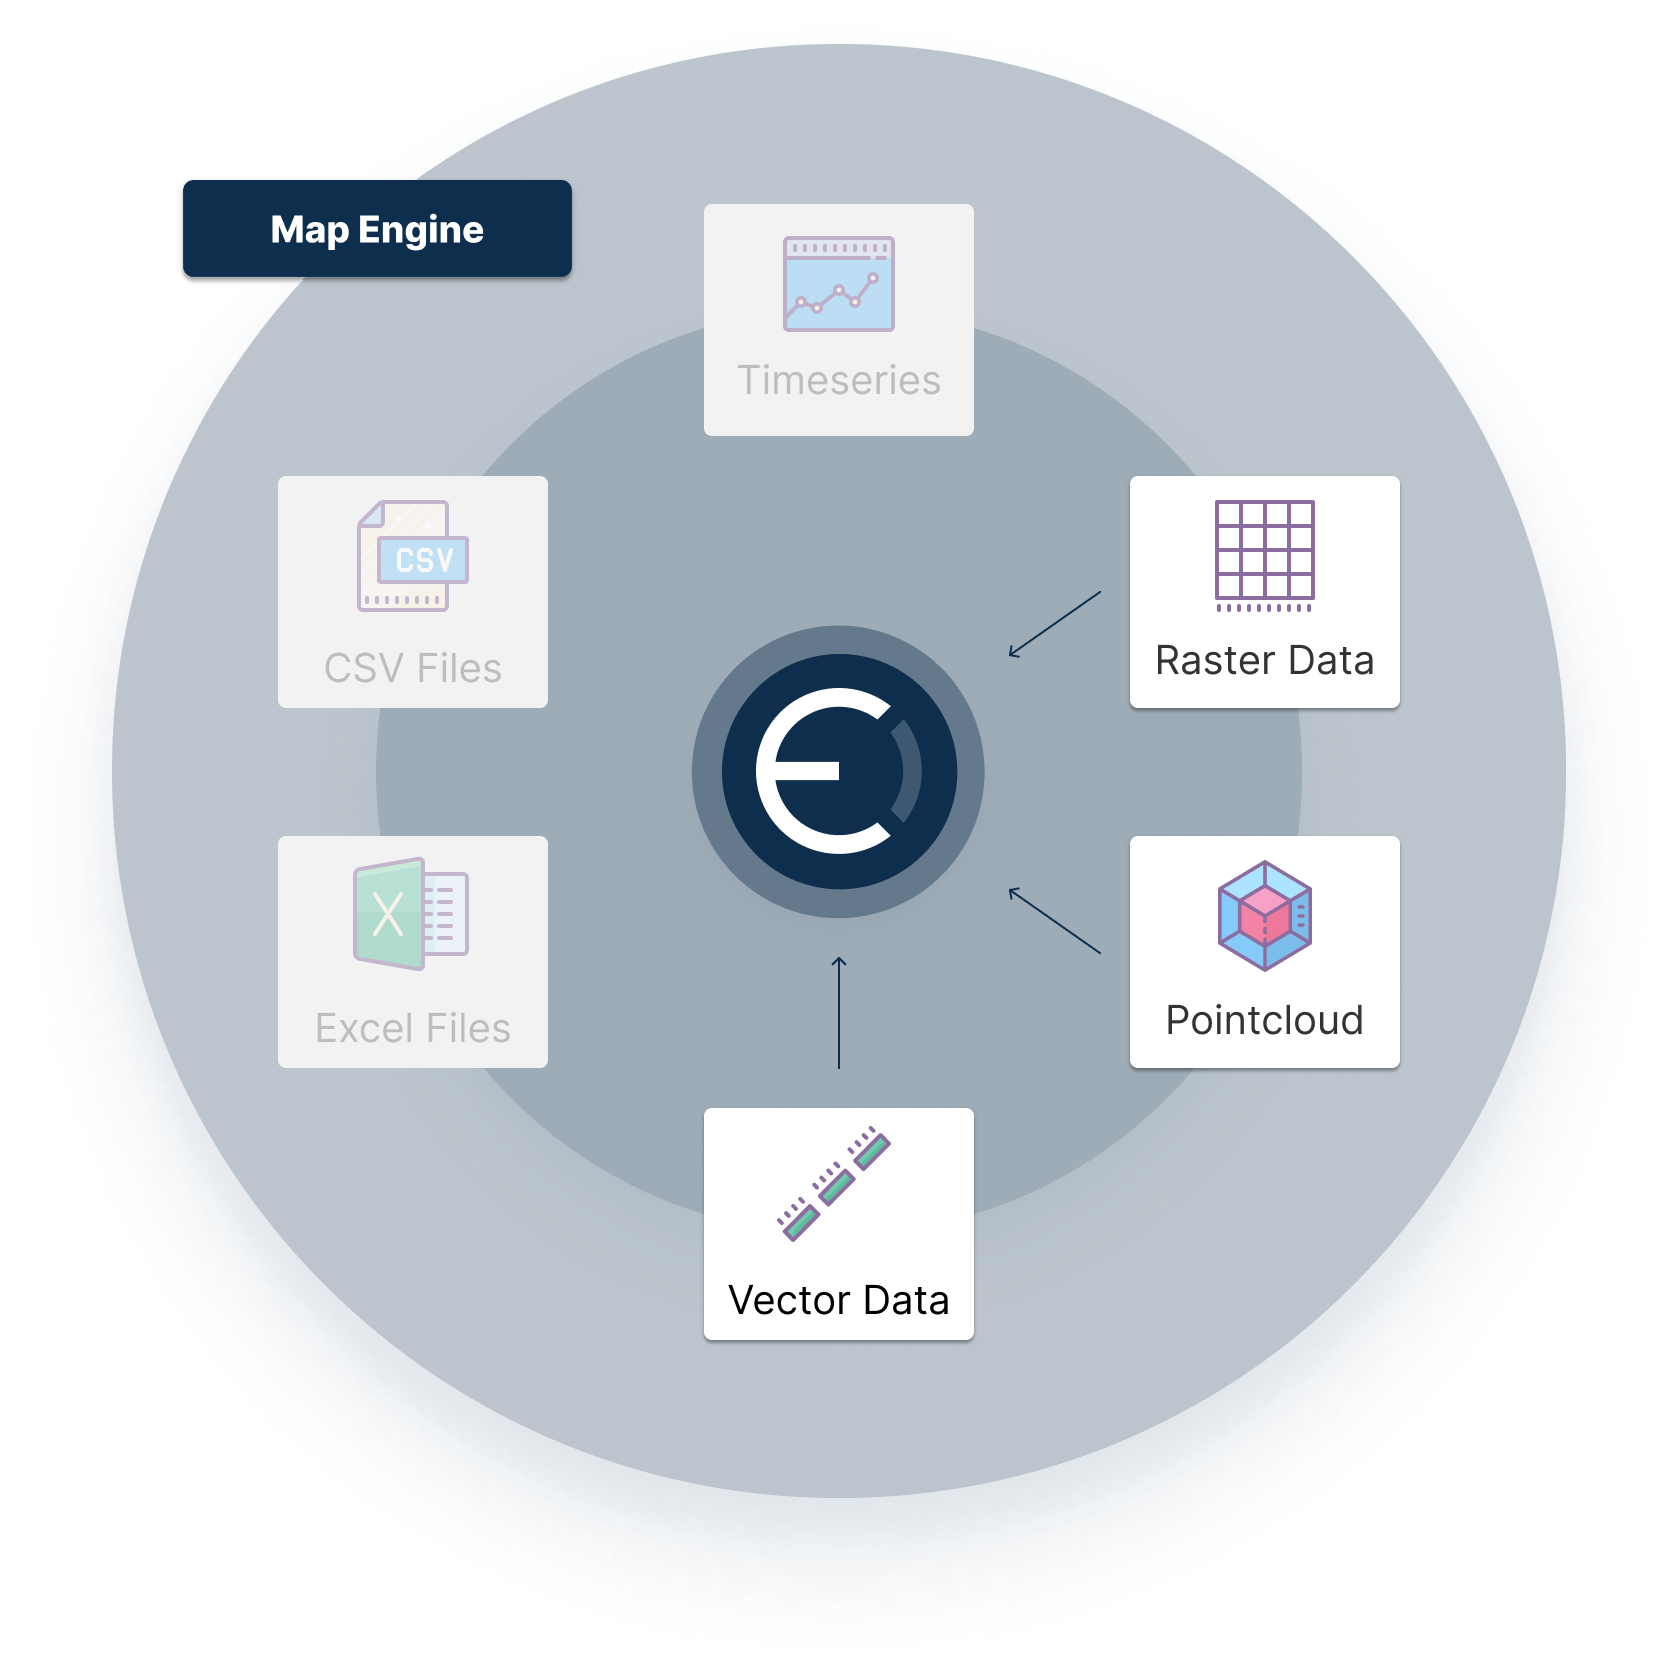
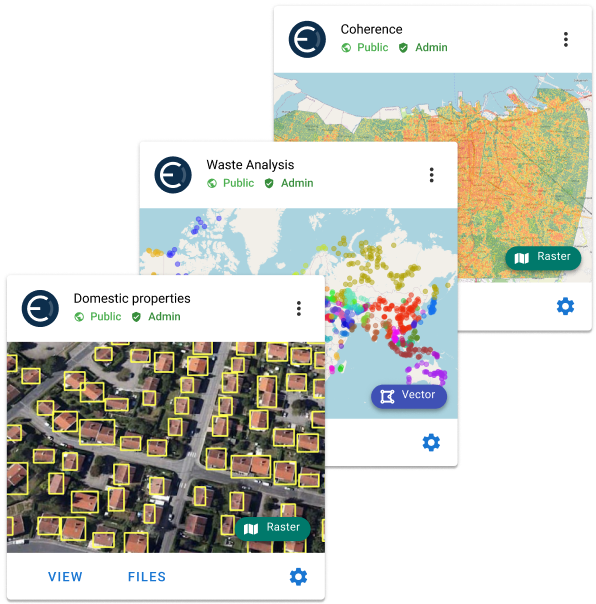
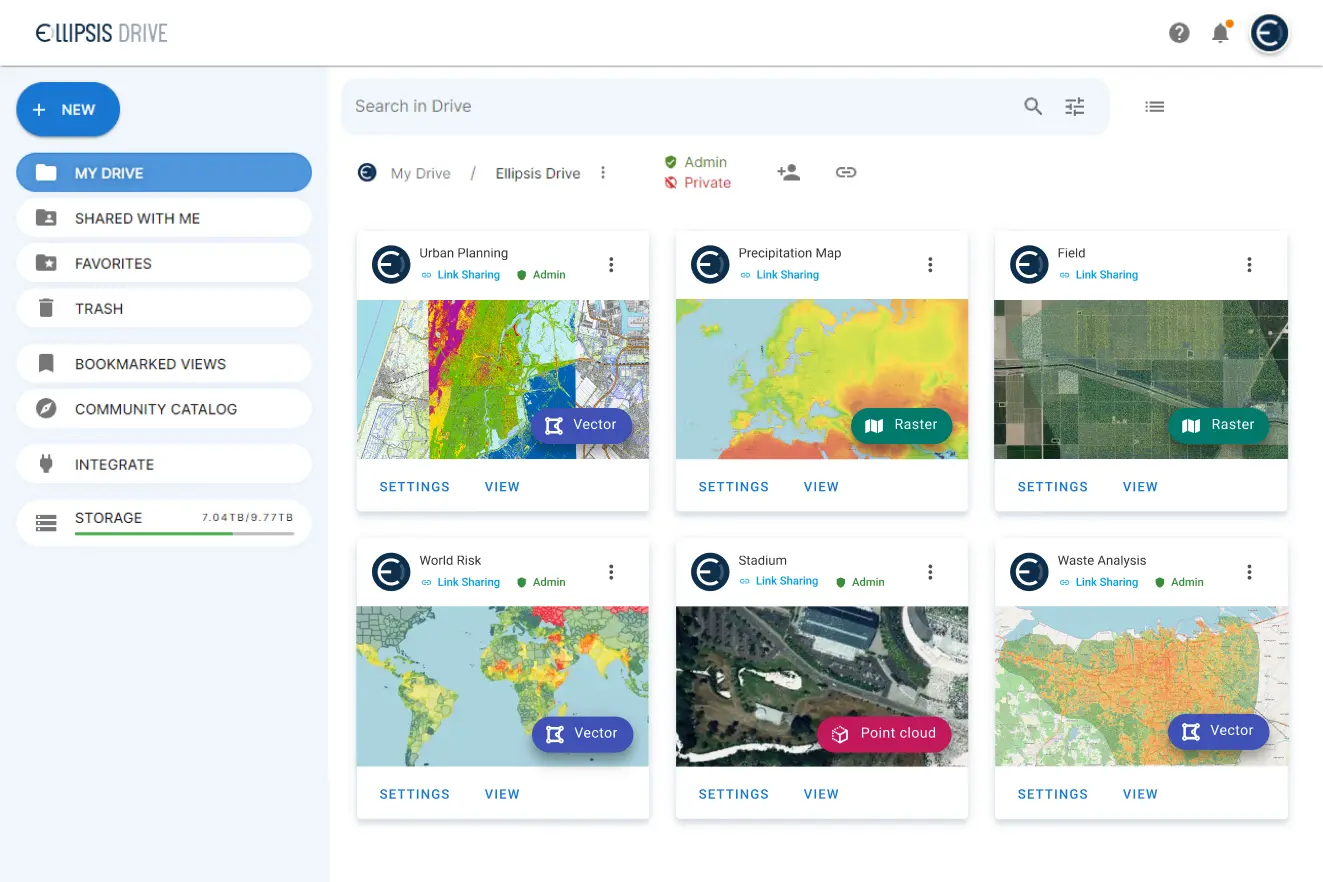
Ellipsis Drive is a fully interoperable, cloud-based, spatial data management solution that simplifies and automates spatial data ingestion, management, and integration. It is specialized to handle geospatial data (including raster, point cloud, and vector data) and thus enables efficient storage, analysis and visualization of spatial data assets.
Here’s a summary of the benefits of using Ellipsis Drive to manage and analyze your non-tabular spatial data, securely deployed within your own data infrastructure -
No manual wrangling: 95%+ time saved on data management and transformation by automating spatial data ingestion, tiling and indexing for effective parallelized analysis.
Speedy compute: Unlimited speed for data querying through spatially-aware data sharding for parallelized compute.
Seamless Access: Instantly access input and output spatial data for high performance and interoperable use and visualization.
Interoperability: Instantly render spatial data into any downstream workflow, stay in-sync and collaborate in real time.
Scalability: 100% scalable spatial data ingestion, management and analytics that connects seamlessly with your databricks-based workflows (more on this in our next blog).
Conclusion
Databricks and Ellipsis Drive represent two essential and mutually beneficial parts of the data analytics ecosystem. While Databricks excels in tabular data processing, Ellipsis Drive specializes in non-tabular (spatial) data handling. Spatial data leaders are combining their unique strengths and creating synergy.
In the next blog, we will talk about the integration of these two solutions and the benefits stemming out of it. There are synergies to be had in the form of streamlined workflows, enhanced collaboration, and deeper insights from diverse datasets. The future of data management lies not in choosing Ellipsis Drive over Data Bricks but in integrating them into a seamless, complementary ecosystem together.
Until next time!
Liked what you read?
Subscribe to our monthly newsletter to receive the latest blogs, news and updates.
Take the Ellipsis Drive tour
in less than 2 minutes'
- A step-by-step guide on how to activate your geospatial data
- Become familiar with our user-friendly interface & design
- View your data integration options
Related Articles
Navigating the Cloud Spectrum: From Generalist to Specialized, and the Perfect Middle Ground
The modern cloud ecosystem spans a wide spectrum of offerings, from general-purpose infrastructure to highly specialized platforms built for domain-specific tasks. At one end, generalist clouds provi
5 min read

Understanding the importance of GIS in Urban Planning
Cities are robust places filled with life, but before it becomes a cosmopolitan paradise, plenty of ever-evolving complexities are happening behind the scenes to bridge the gaps and create an area spa
3 min read
Ellipsis Map Engine: Fast and Easy Spatial Data Science at Scale
In previous articles, we’ve established that raster data is unique compared to other data types which explains why there is a major lack of infrastructure for raster data processing. Raster data is
4 min read